Movie Box ROI Prediction
A time-aware pipeline for forecasting film revenue and supporting ROI decision policies, with an end-to-end web application.
Course Project: IS5126 (AY 2025–2026 Sem 1), Group 11
Highlights
- Built an end-to-end pipeline: EDA → rigorous cleaning → time-aware modeling → ROI decisioning → web application
- Prevented temporal leakage via chronological splits (distribution drift is significant across decades)
- Achieved strong performance with a tabular Transformer (attention-based regression)
- Delivered a FastAPI + Streamlit application for multilingual search, prediction, and LLM-generated promotional taglines
Dataset
Source: Kaggle “The Movies Dataset” (TMDB + MovieLens).
The focus is on TMDB-style movie metadata for entity-based prediction (given a movie and its properties, predict revenue / ROI-related signals).
Key data properties observed:
- 45,466 movies in total, but only ~11.8% have complete
budgetandrevenue - High missingness in several fields (e.g., ~55% missing taglines; ~90% missing collection membership)
- Duplicate entries exist across source files and require deduplication
- Release years span 1874–2020, with a strong long-tail (very sparse in early years)
Exploratory Data Analysis
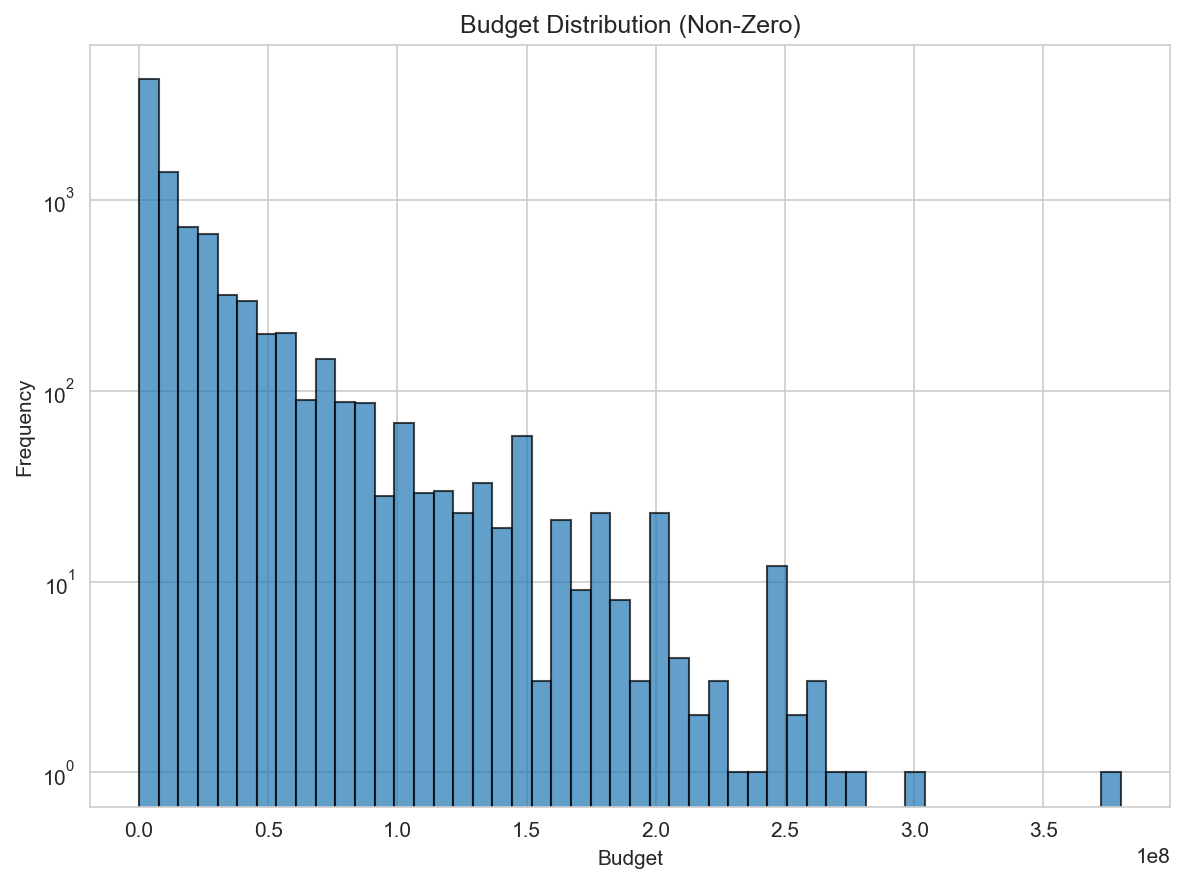
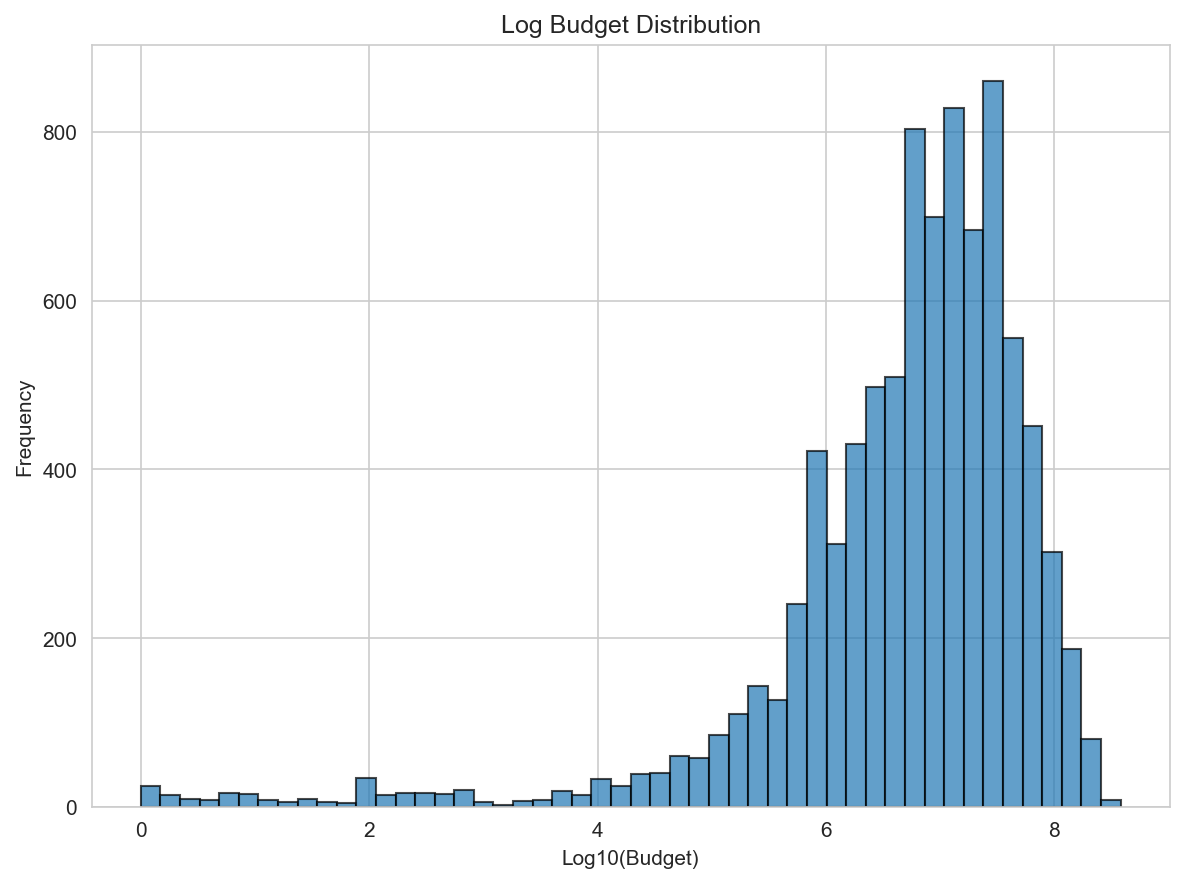
Budget distribution and log transform
Movie budgets are heavily right-skewed. A log transform compresses extreme values and stabilizes variance.
| Original | Log-transformed |
|---|---|
 |
 |
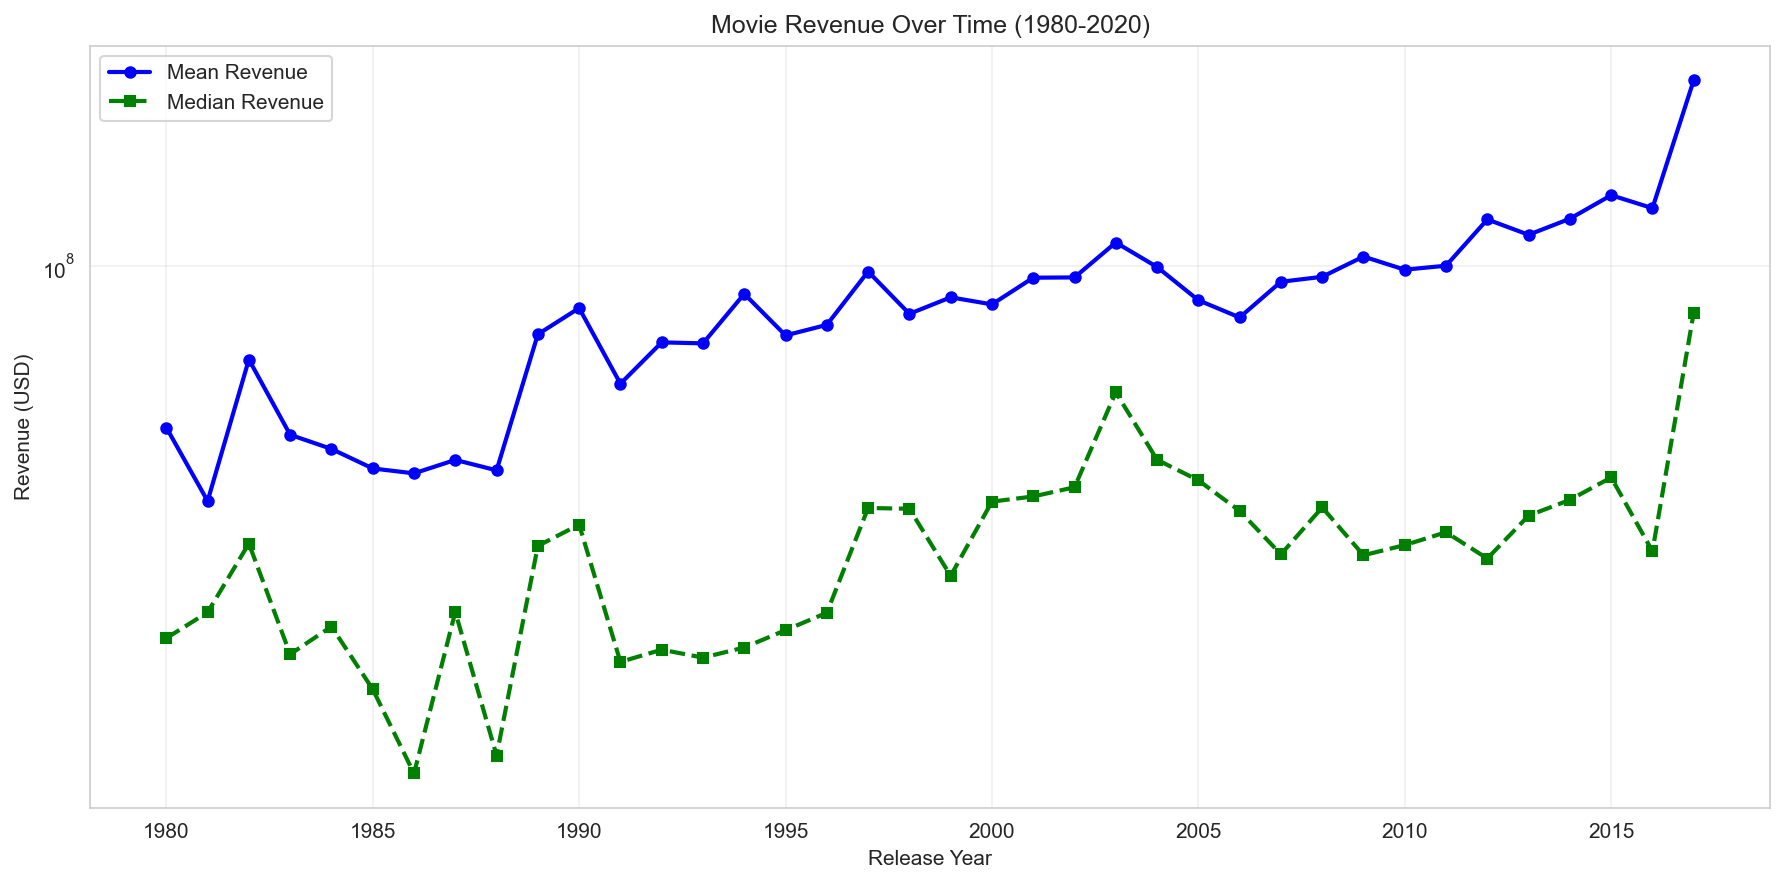
Temporal trend in revenue
Revenue shows a clear upward trend over time, indicating strong temporal dependence and distribution drift. This motivates time-based splitting to avoid leakage across release years.
Data Preprocessing and Cleaning
1) Initial feature exclusion (anti-leakage)
Variables that are unsuitable for realistic pre-release prediction are removed:
- Direct target-related financial outcomes (
budget,revenue,roi) - Metadata identifiers and raw text/list attributes that require dedicated encoding pipelines (
id,title,genre_names,cast_list,overview) - Unencoded categorical placeholders (e.g.,
budget_category) - Post-release popularity signals (e.g.,
popularity,vote_count) that are not available at decision time
This keeps the feature space aligned with inference-time availability and avoids inflated metrics.
2) Data filtering rules
Thresholds are chosen based on distribution inspection:
- Deduplicate repeated movie IDs to enforce one film per sample
- Keep movies with strictly positive budget and revenue values
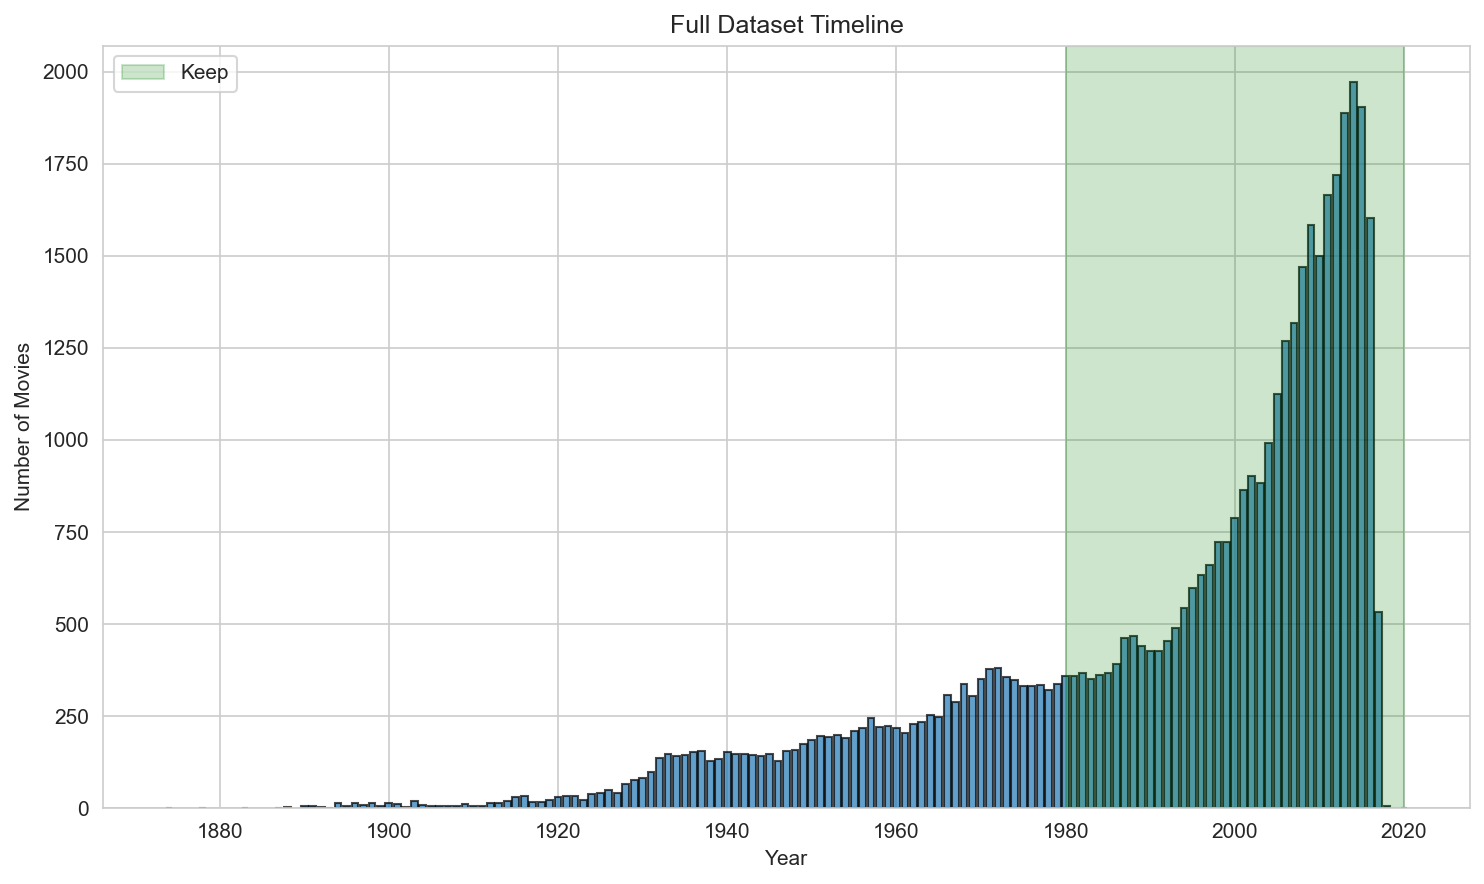
- Restrict release years to 1980–2020 (sparse early years; unstable post-2020 due to incomplete records)
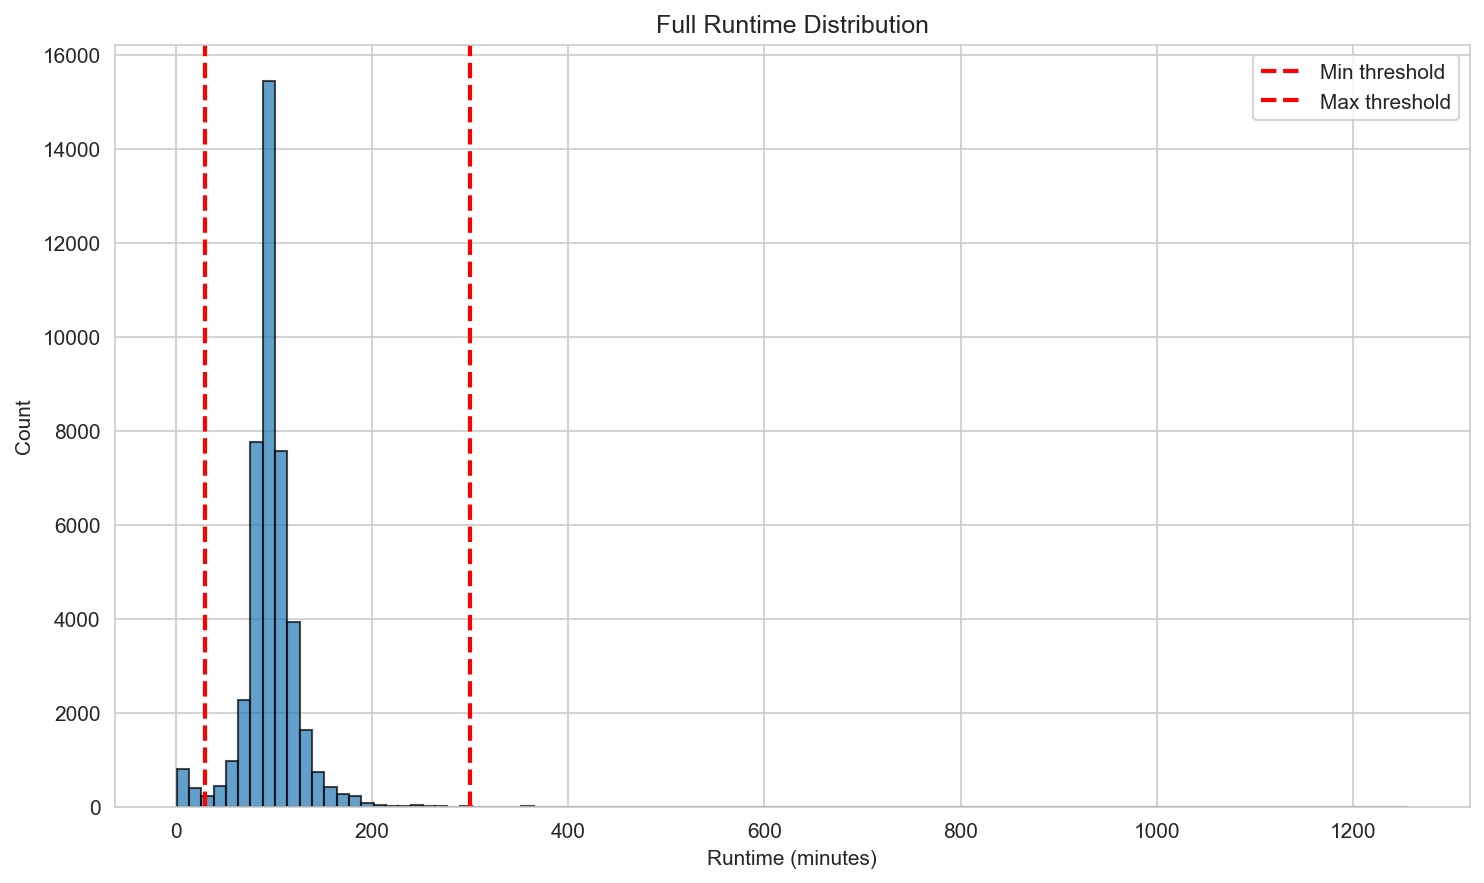
- Restrict runtime to 30–300 minutes to remove extreme outliers
| Release year distribution (for threshold setting) | Runtime distribution (for threshold setting) |
|---|---|
 |
 |
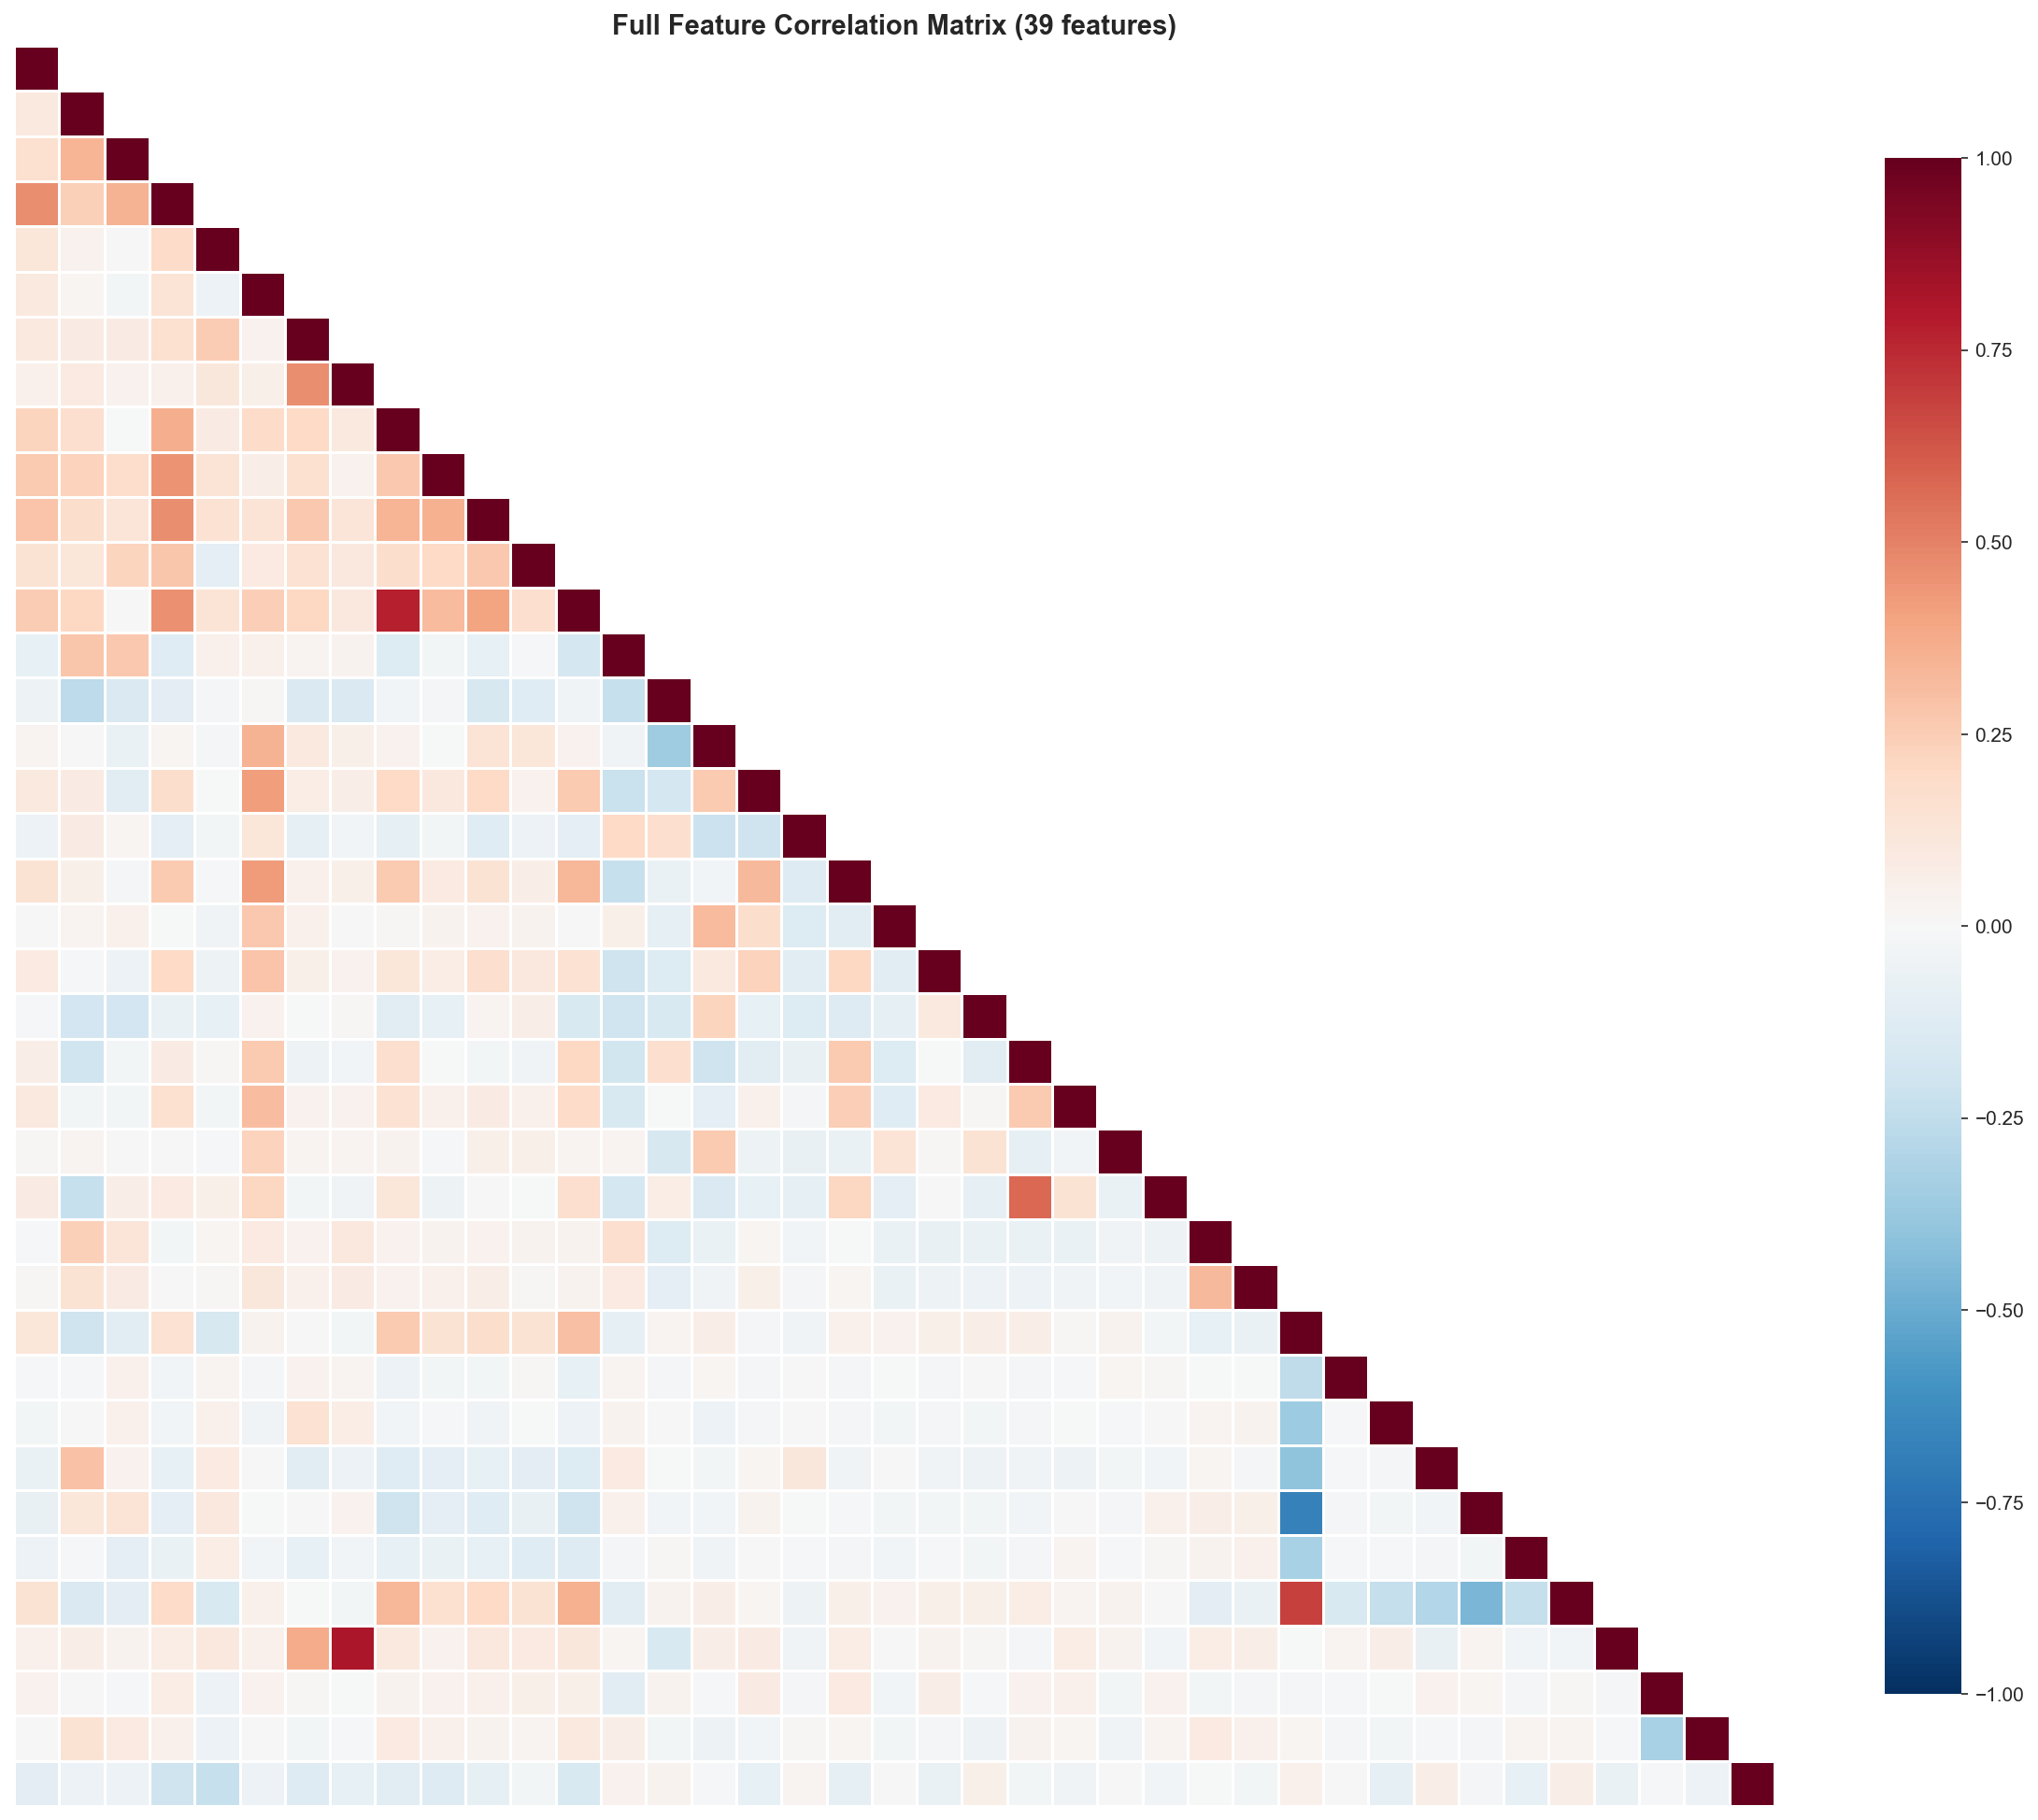
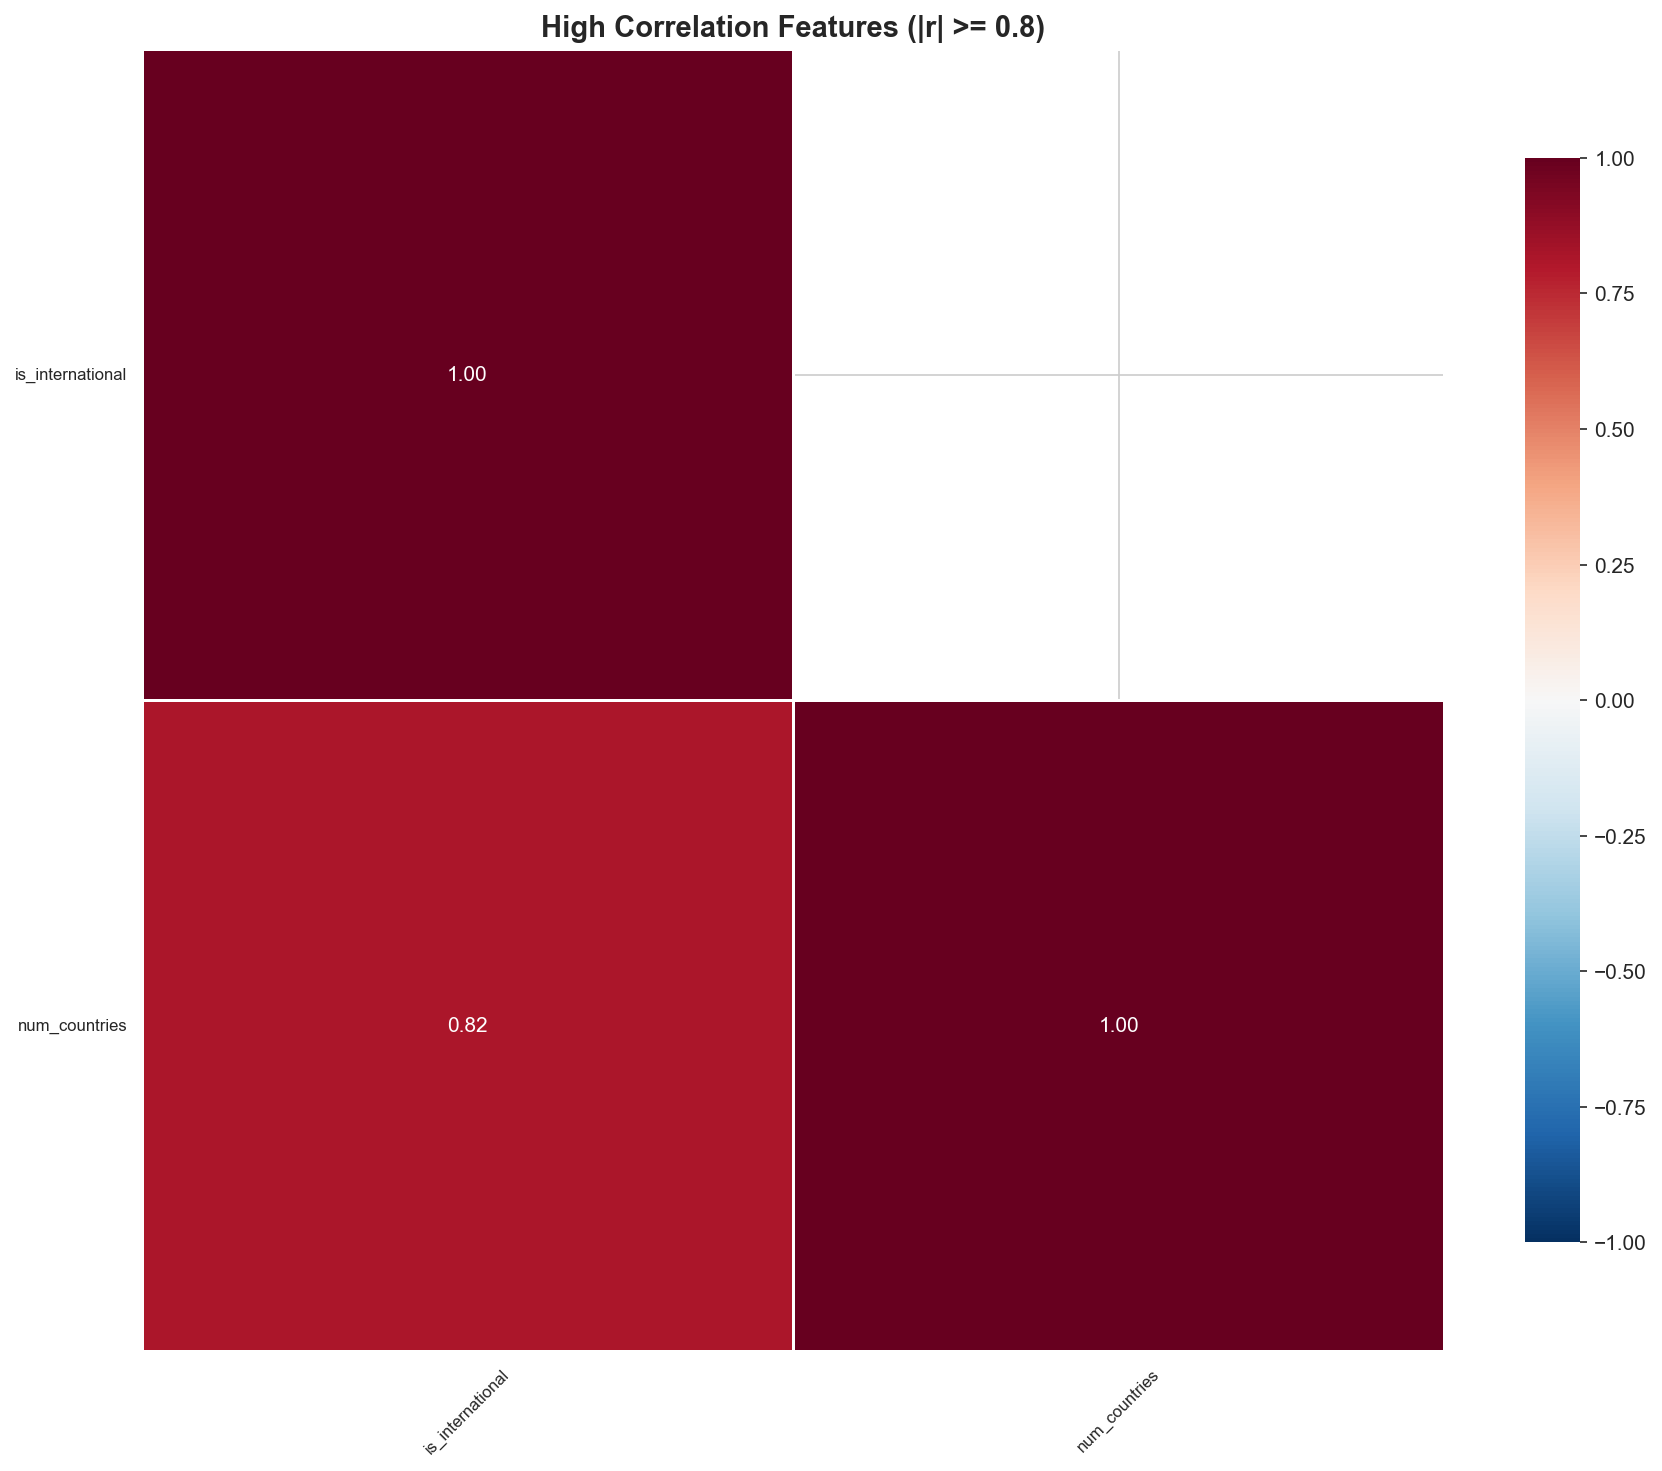
3) Correlation-based feature pruning
A Pearson correlation matrix is computed across numerical features. Feature pairs with |r| ≥ 0.8 are treated as redundant; one of each pair is removed to reduce multicollinearity and simplify the feature space.
| Full correlation matrix | High-correlation view |
|---|---|
 |
 |
Feature Engineering Explorations
Several feature directions were tested to enrich signal beyond basic metadata:
- TF-IDF on movie overviews
- Overviews were summarized to reduce dimensionality, then vectorized with TF‑IDF (top features retained).
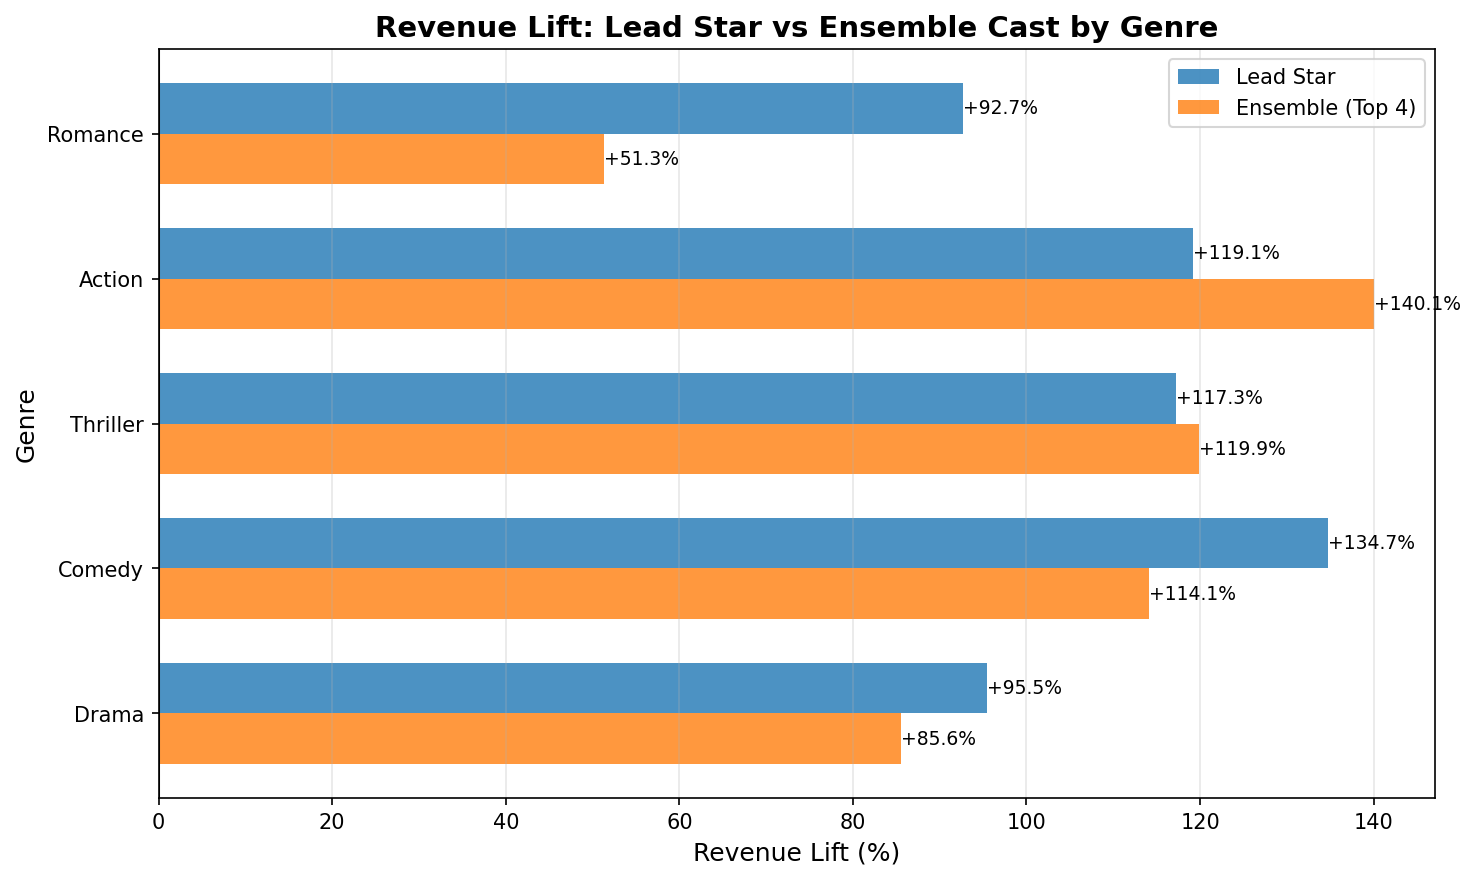
- Cast and production-company features
- Lead / ensemble “star power” derived from cast film counts prior to the movie
- Indicator for major production company presence
- Interaction features
- Genre × season, genre combinations, cast star power × season, genre × cast star power
These features produced interesting patterns in exploratory analysis, but did not consistently improve predictive performance and occasionally reduced generalization.
Modeling
Evaluation protocol: chronological split
Models are trained and evaluated with a chronological train/validation/test split to respect temporal drift and reduce leakage.
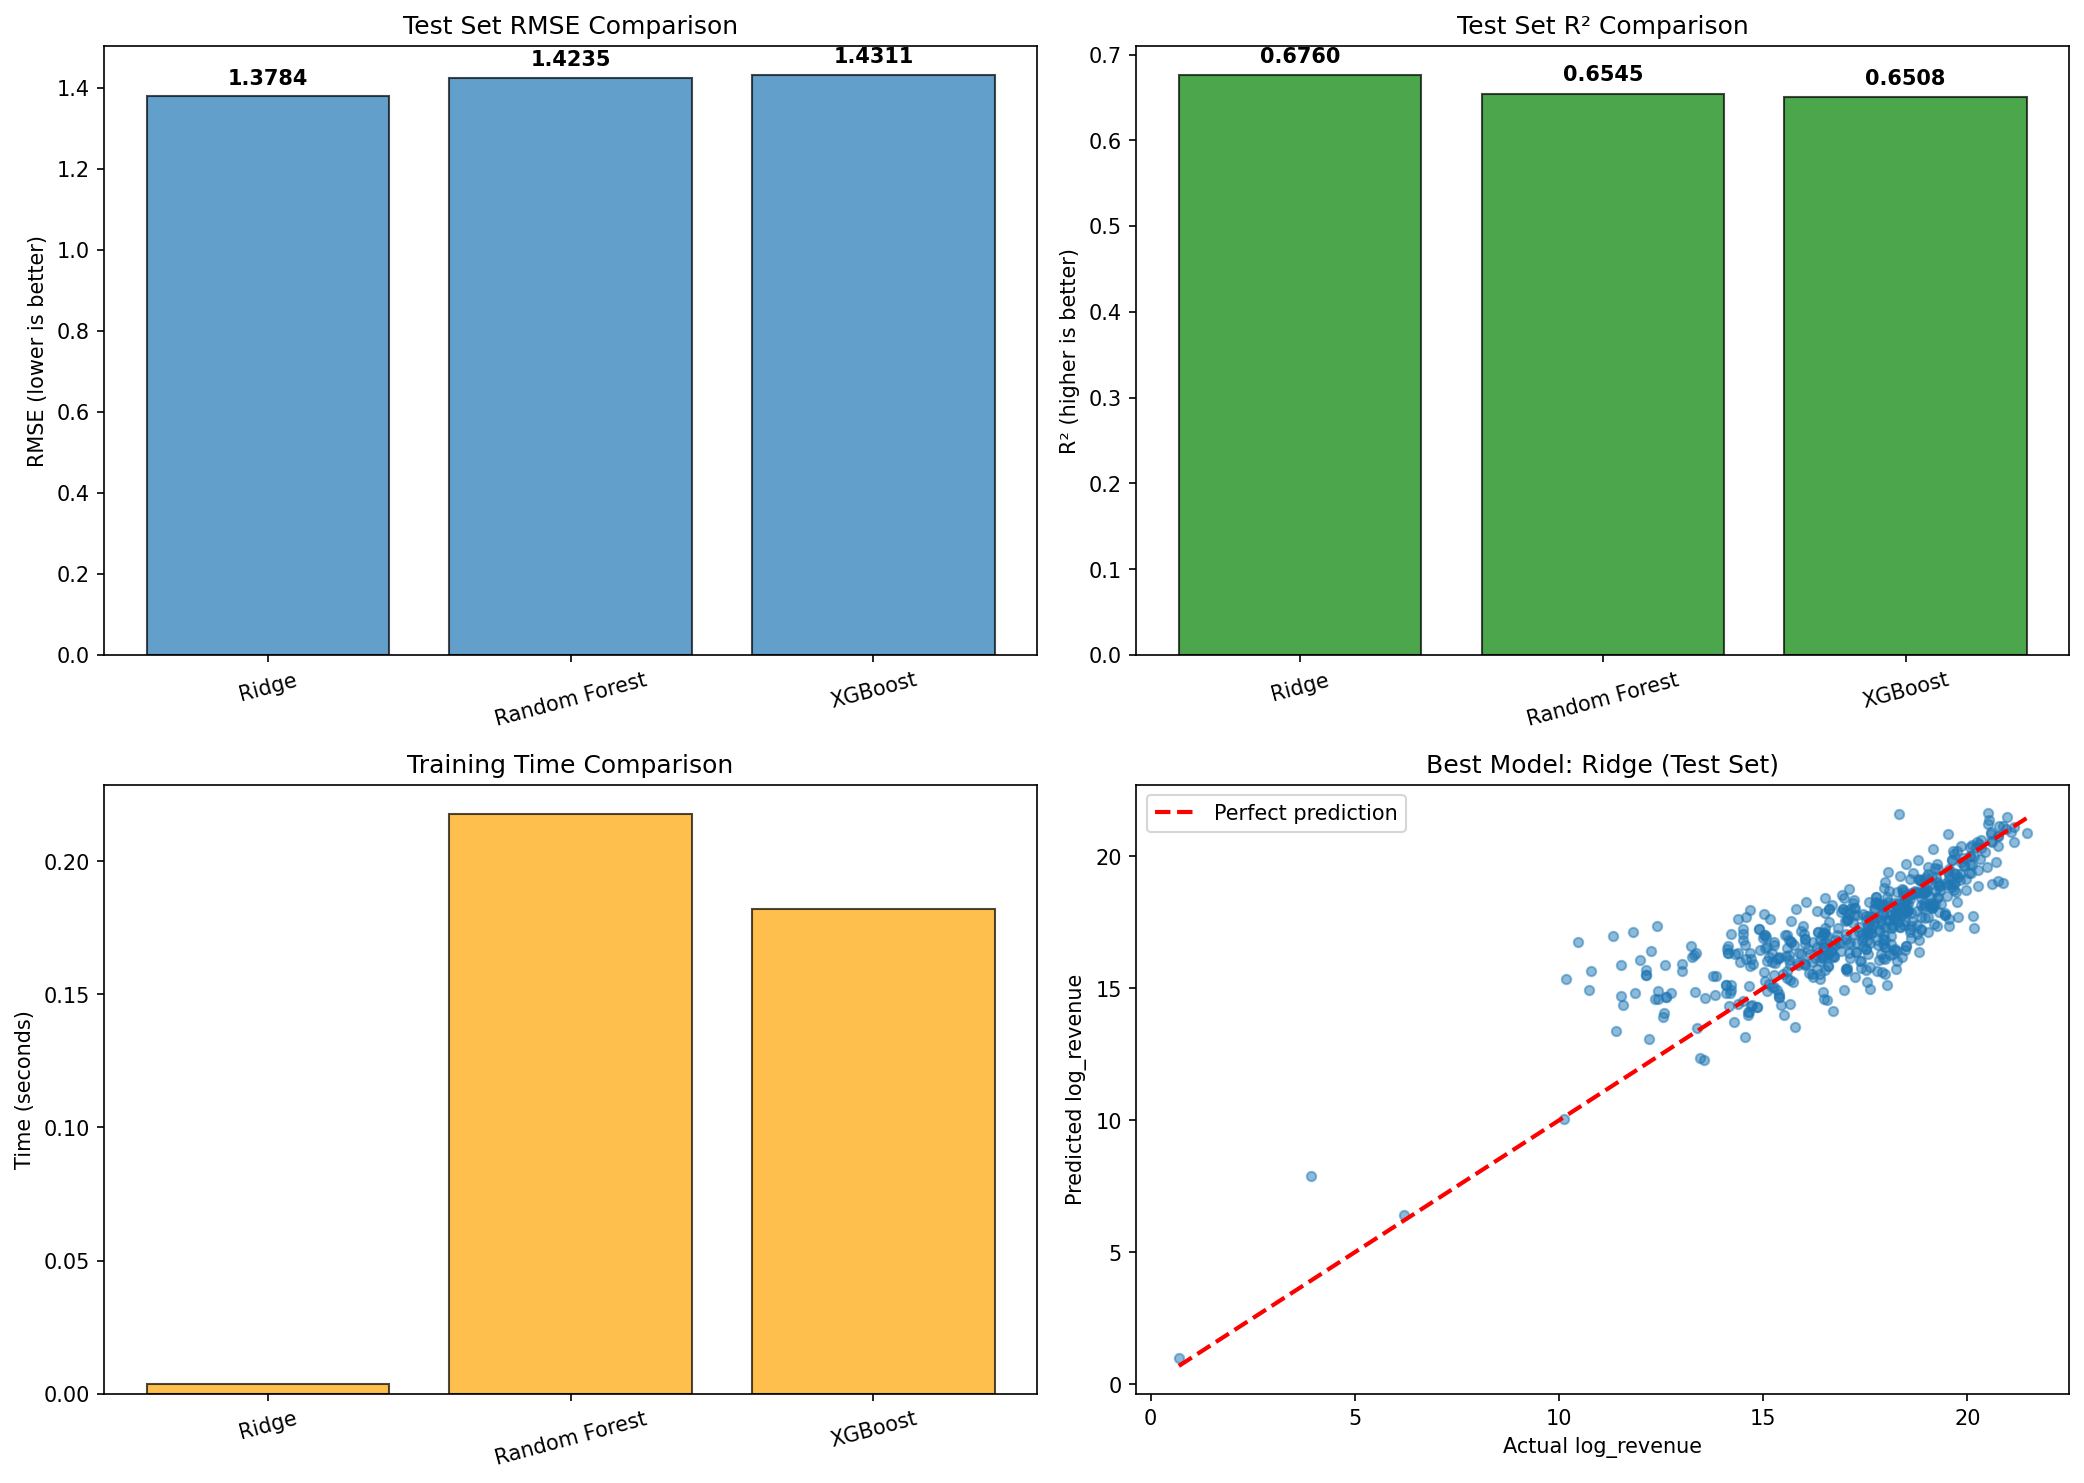
Baselines
Implemented classical tabular baselines:
- Ridge Regression
- Random Forest
- XGBoost
- Randomized hyperparameter search for Random Forest and XGBoost
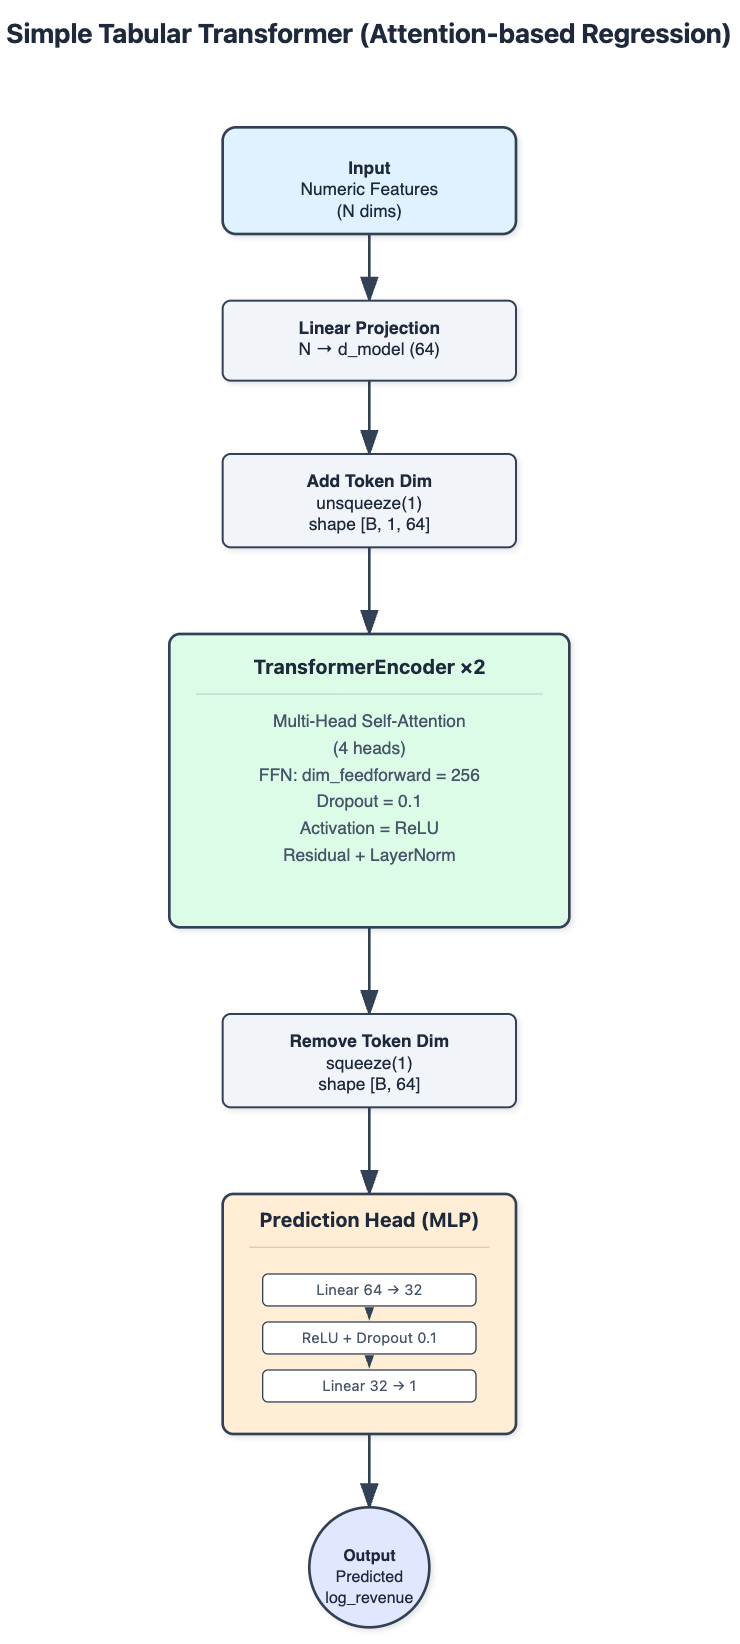
Tabular Transformer (attention-based regression)
A simplified Transformer for tabular regression:
- Numeric features projected into a shared latent space (d_model = 64)
- 2-layer Transformer encoder, 4 heads, dropout = 0.1
- Feed-forward prediction head
- Training: Adam (lr=0.001), MSE loss, batch size 64, up to 50 epochs, early stopping (patience 10), best checkpoint reloaded
Results summary
| Model | Test RMSE | Test MAE | Test R² |
|---|---|---|---|
| Transformer (Ready) | 1.012 | 0.687 | 0.830 |
| Transformer (Feature Engineering) | 1.052 | 0.601 | 0.816 |
| RF (Tuned) | 1.412 | 1.041 | 0.660 |
| XGB (Tuned) | 1.411 | 1.020 | 0.660 |
| Ridge | 1.378 | 0.996 | 0.676 |
| Transformer (Basic) | 1.473 | 1.085 | 0.638 |
ROI Decision Policies
ROI decisioning is derived from sensitivity and cost–benefit analyses, followed by an out-of-time backtest.
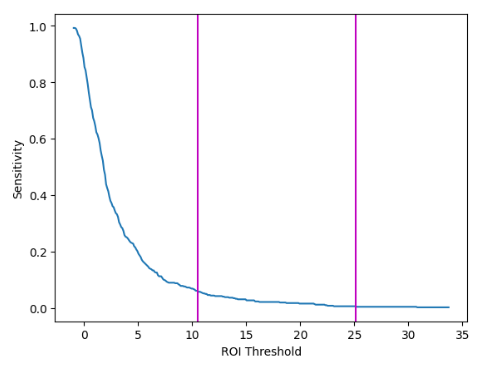
- Sensitivity drops rapidly when the ROI threshold is below 10.5, then flattens until about 25.1, after which gains become negligible.
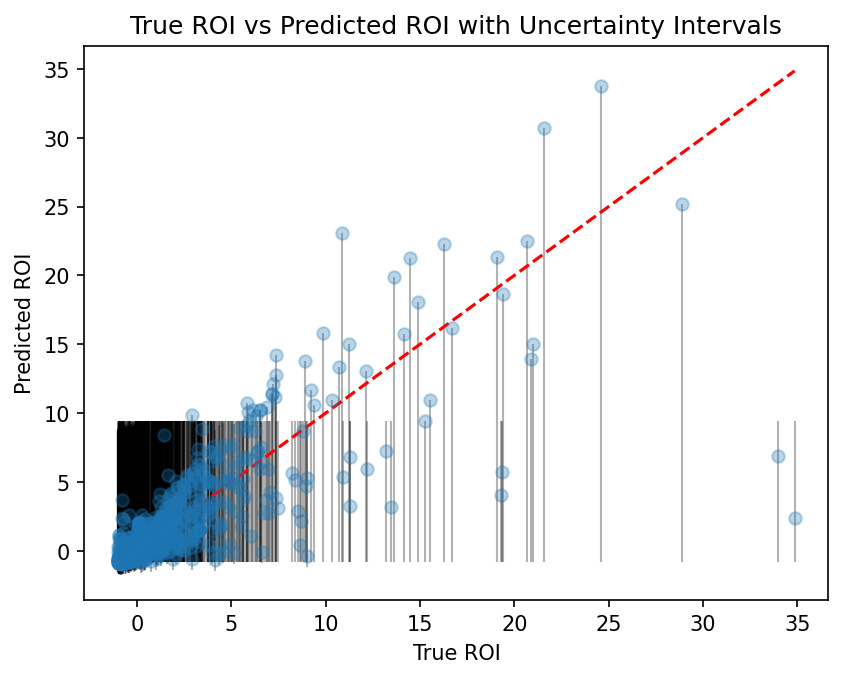
- The true vs. predicted ROI scatter supports the threshold behavior: alignment is tighter at lower thresholds and becomes more dispersed at higher thresholds.
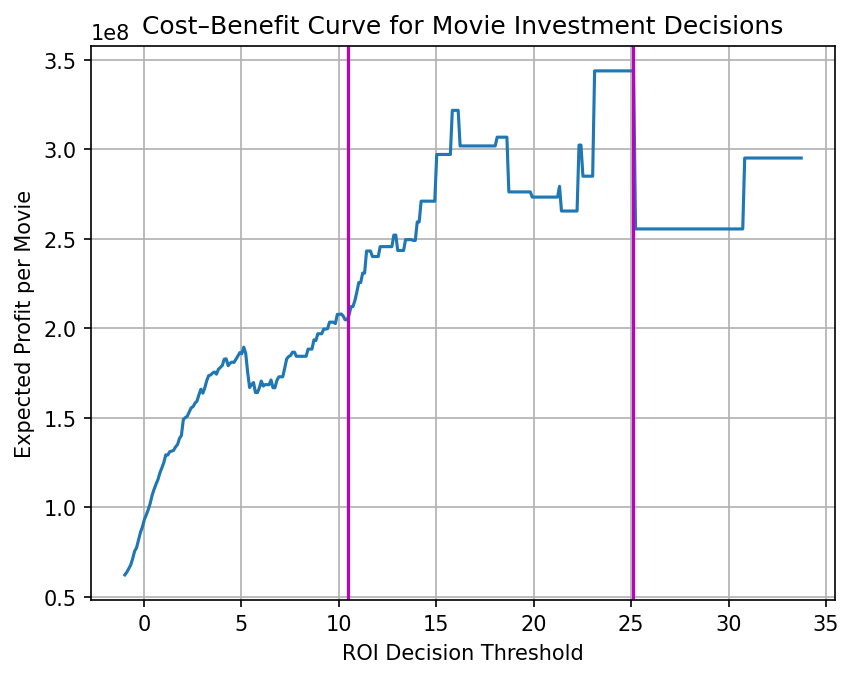
- The cost–benefit curve suggests expected profit peaks within the 10.5–25.1 interval.
- Based on this, three policies are defined using 10.5 and 25.1 as split points:
- Low Risk: ROI ≤ 10.5
- Medium Risk: ROI ≤ 25.1
- High Risk: ROI ≤ ∞
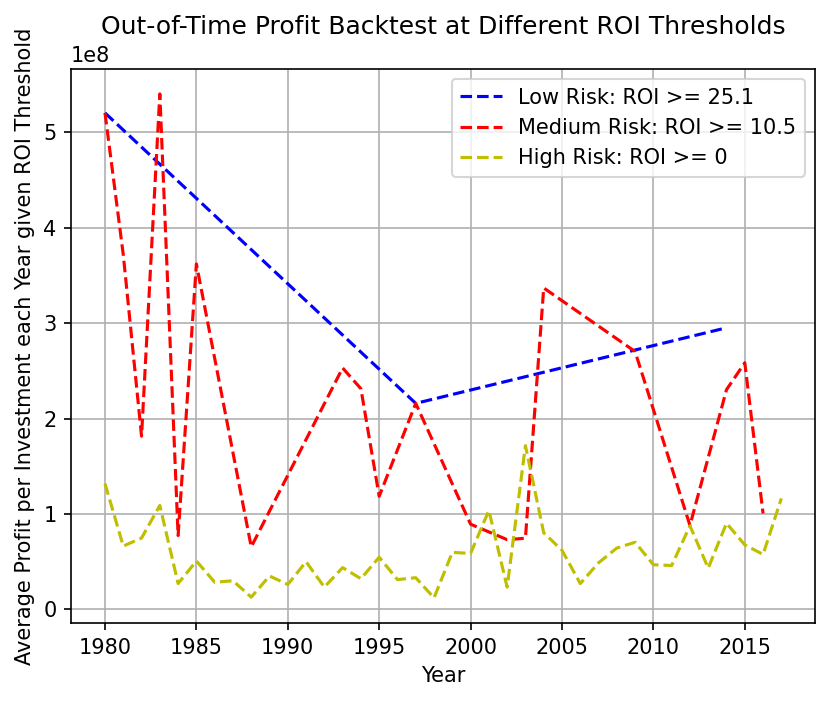
- The out-of-time yearly backtest compares policies on accumulated true profit:
- Low Risk tends to deliver higher profit per approved investment but approves fewer projects.
- Medium Risk provides a balanced tradeoff between approval volume and value.
- High Risk is most permissive but often yields lower value per investment.
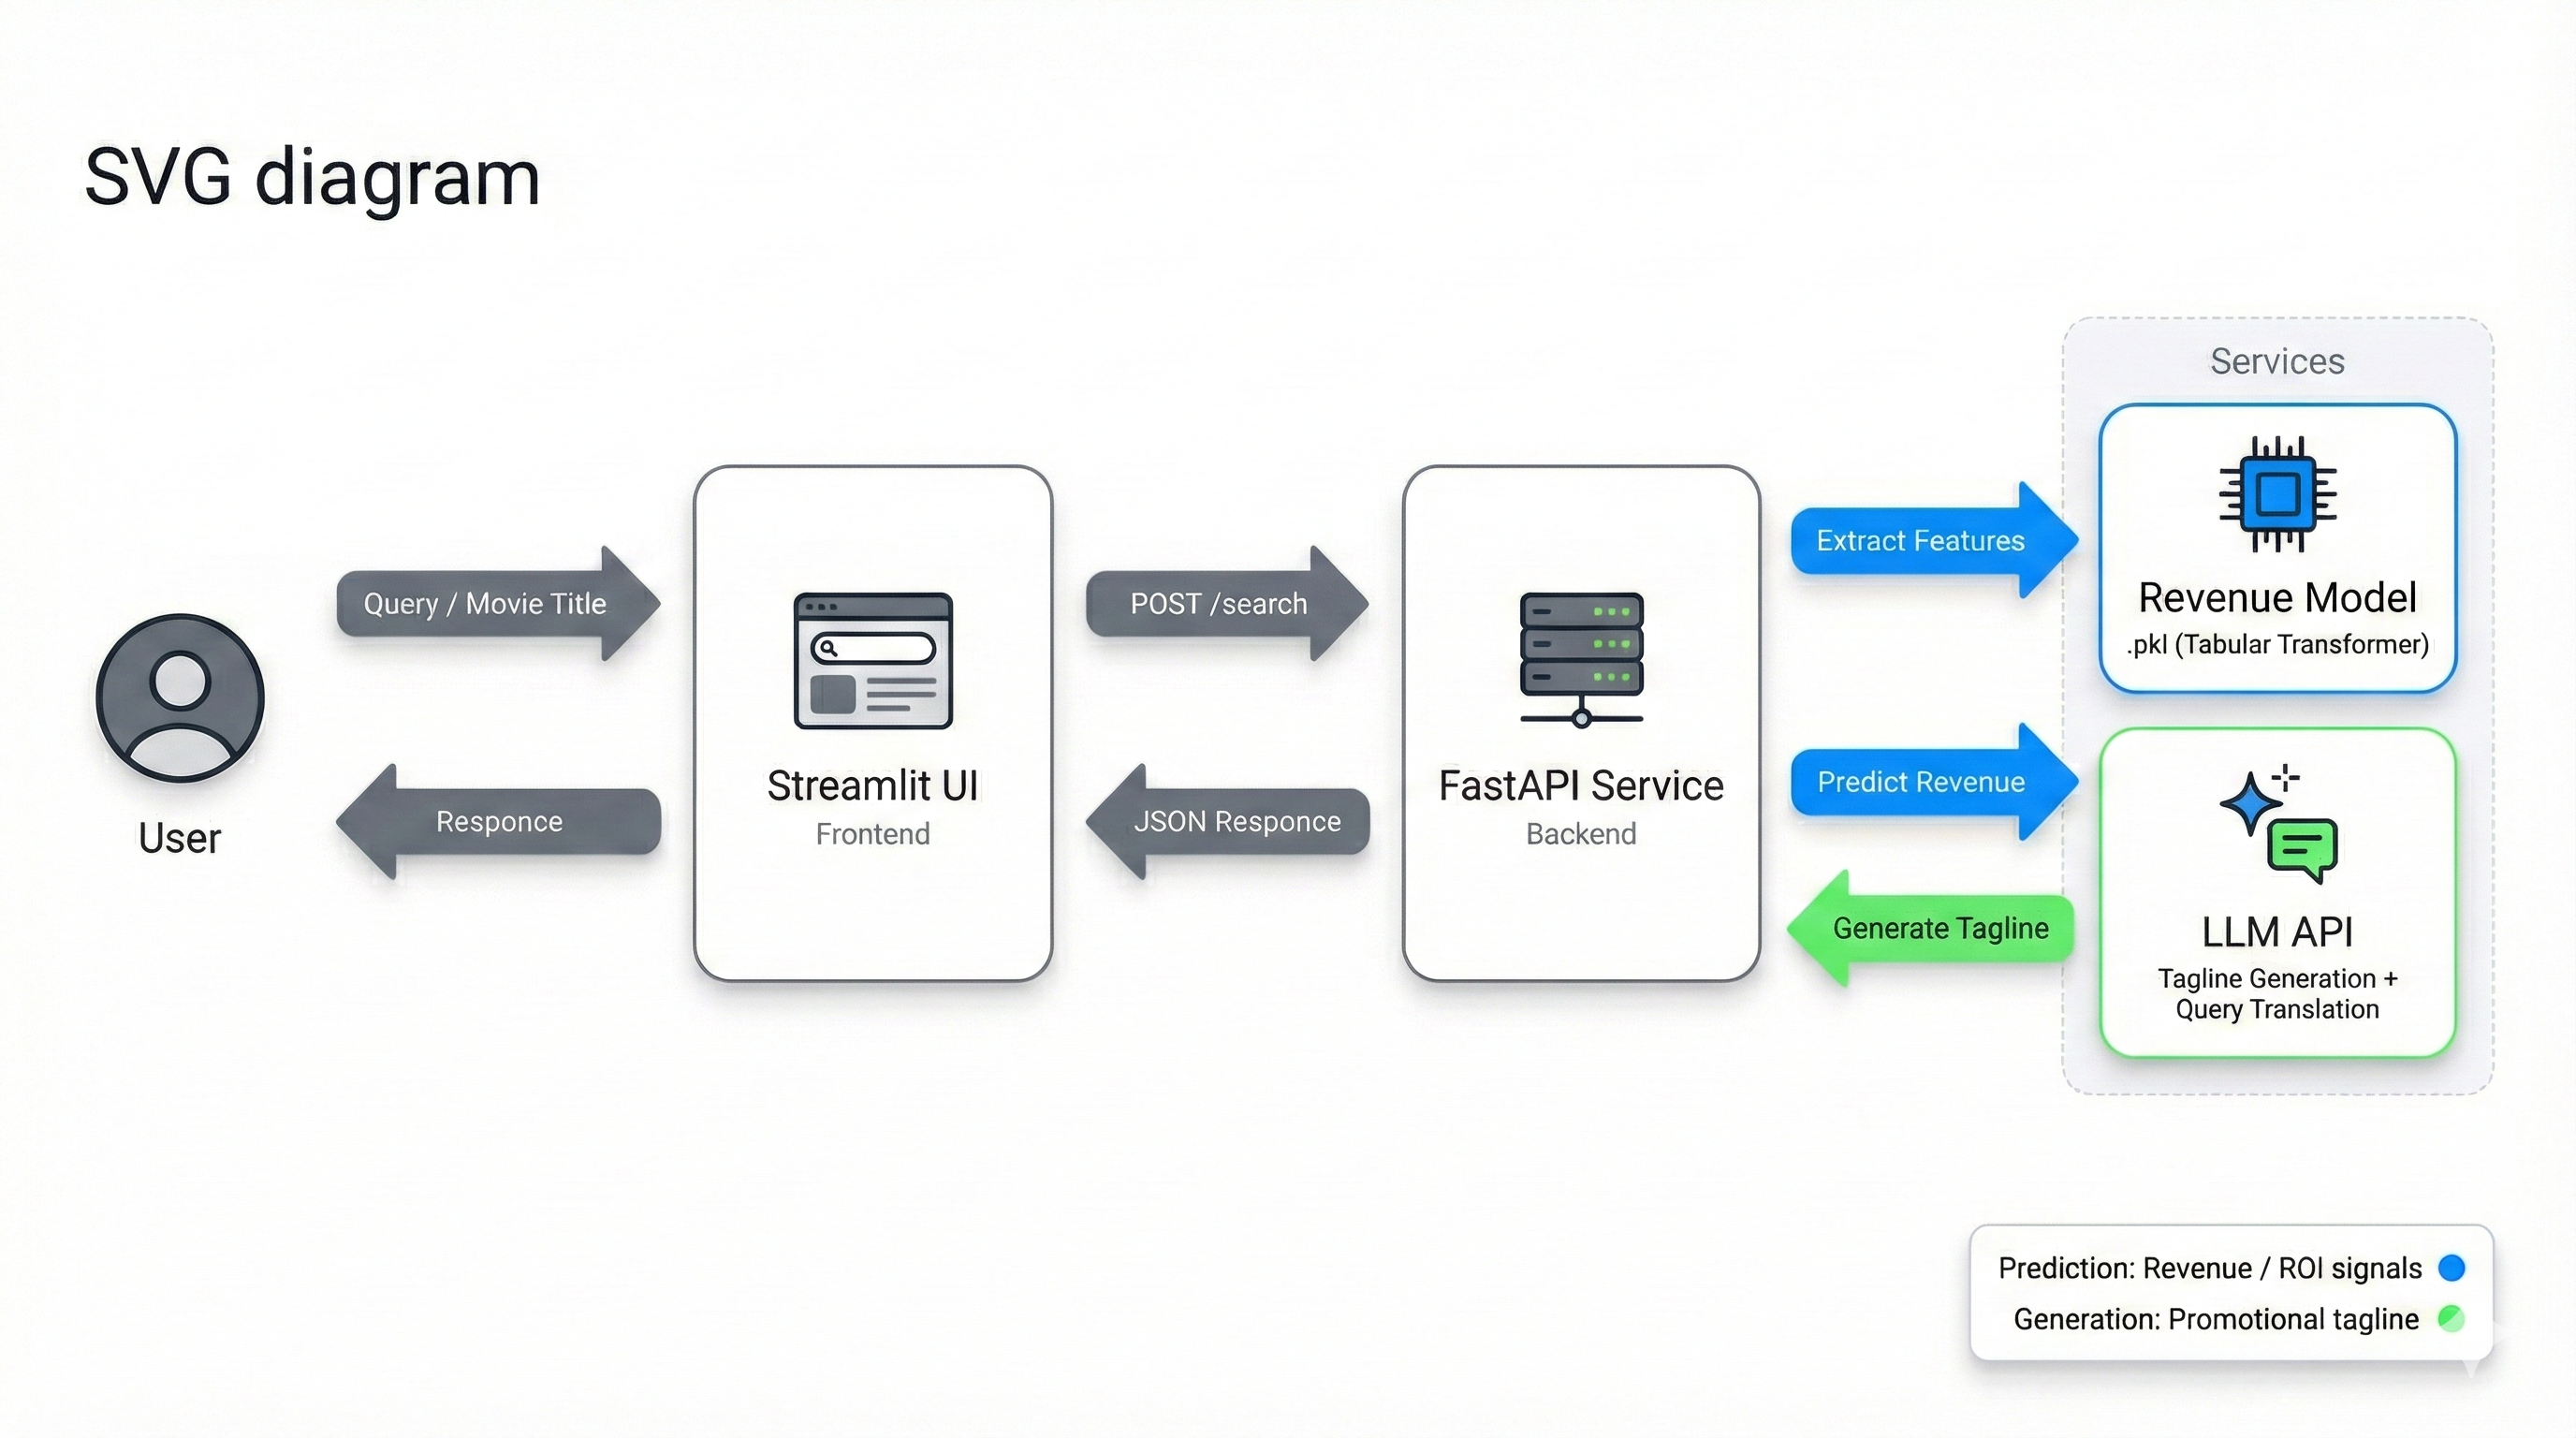
Web Application (FastAPI + Streamlit)
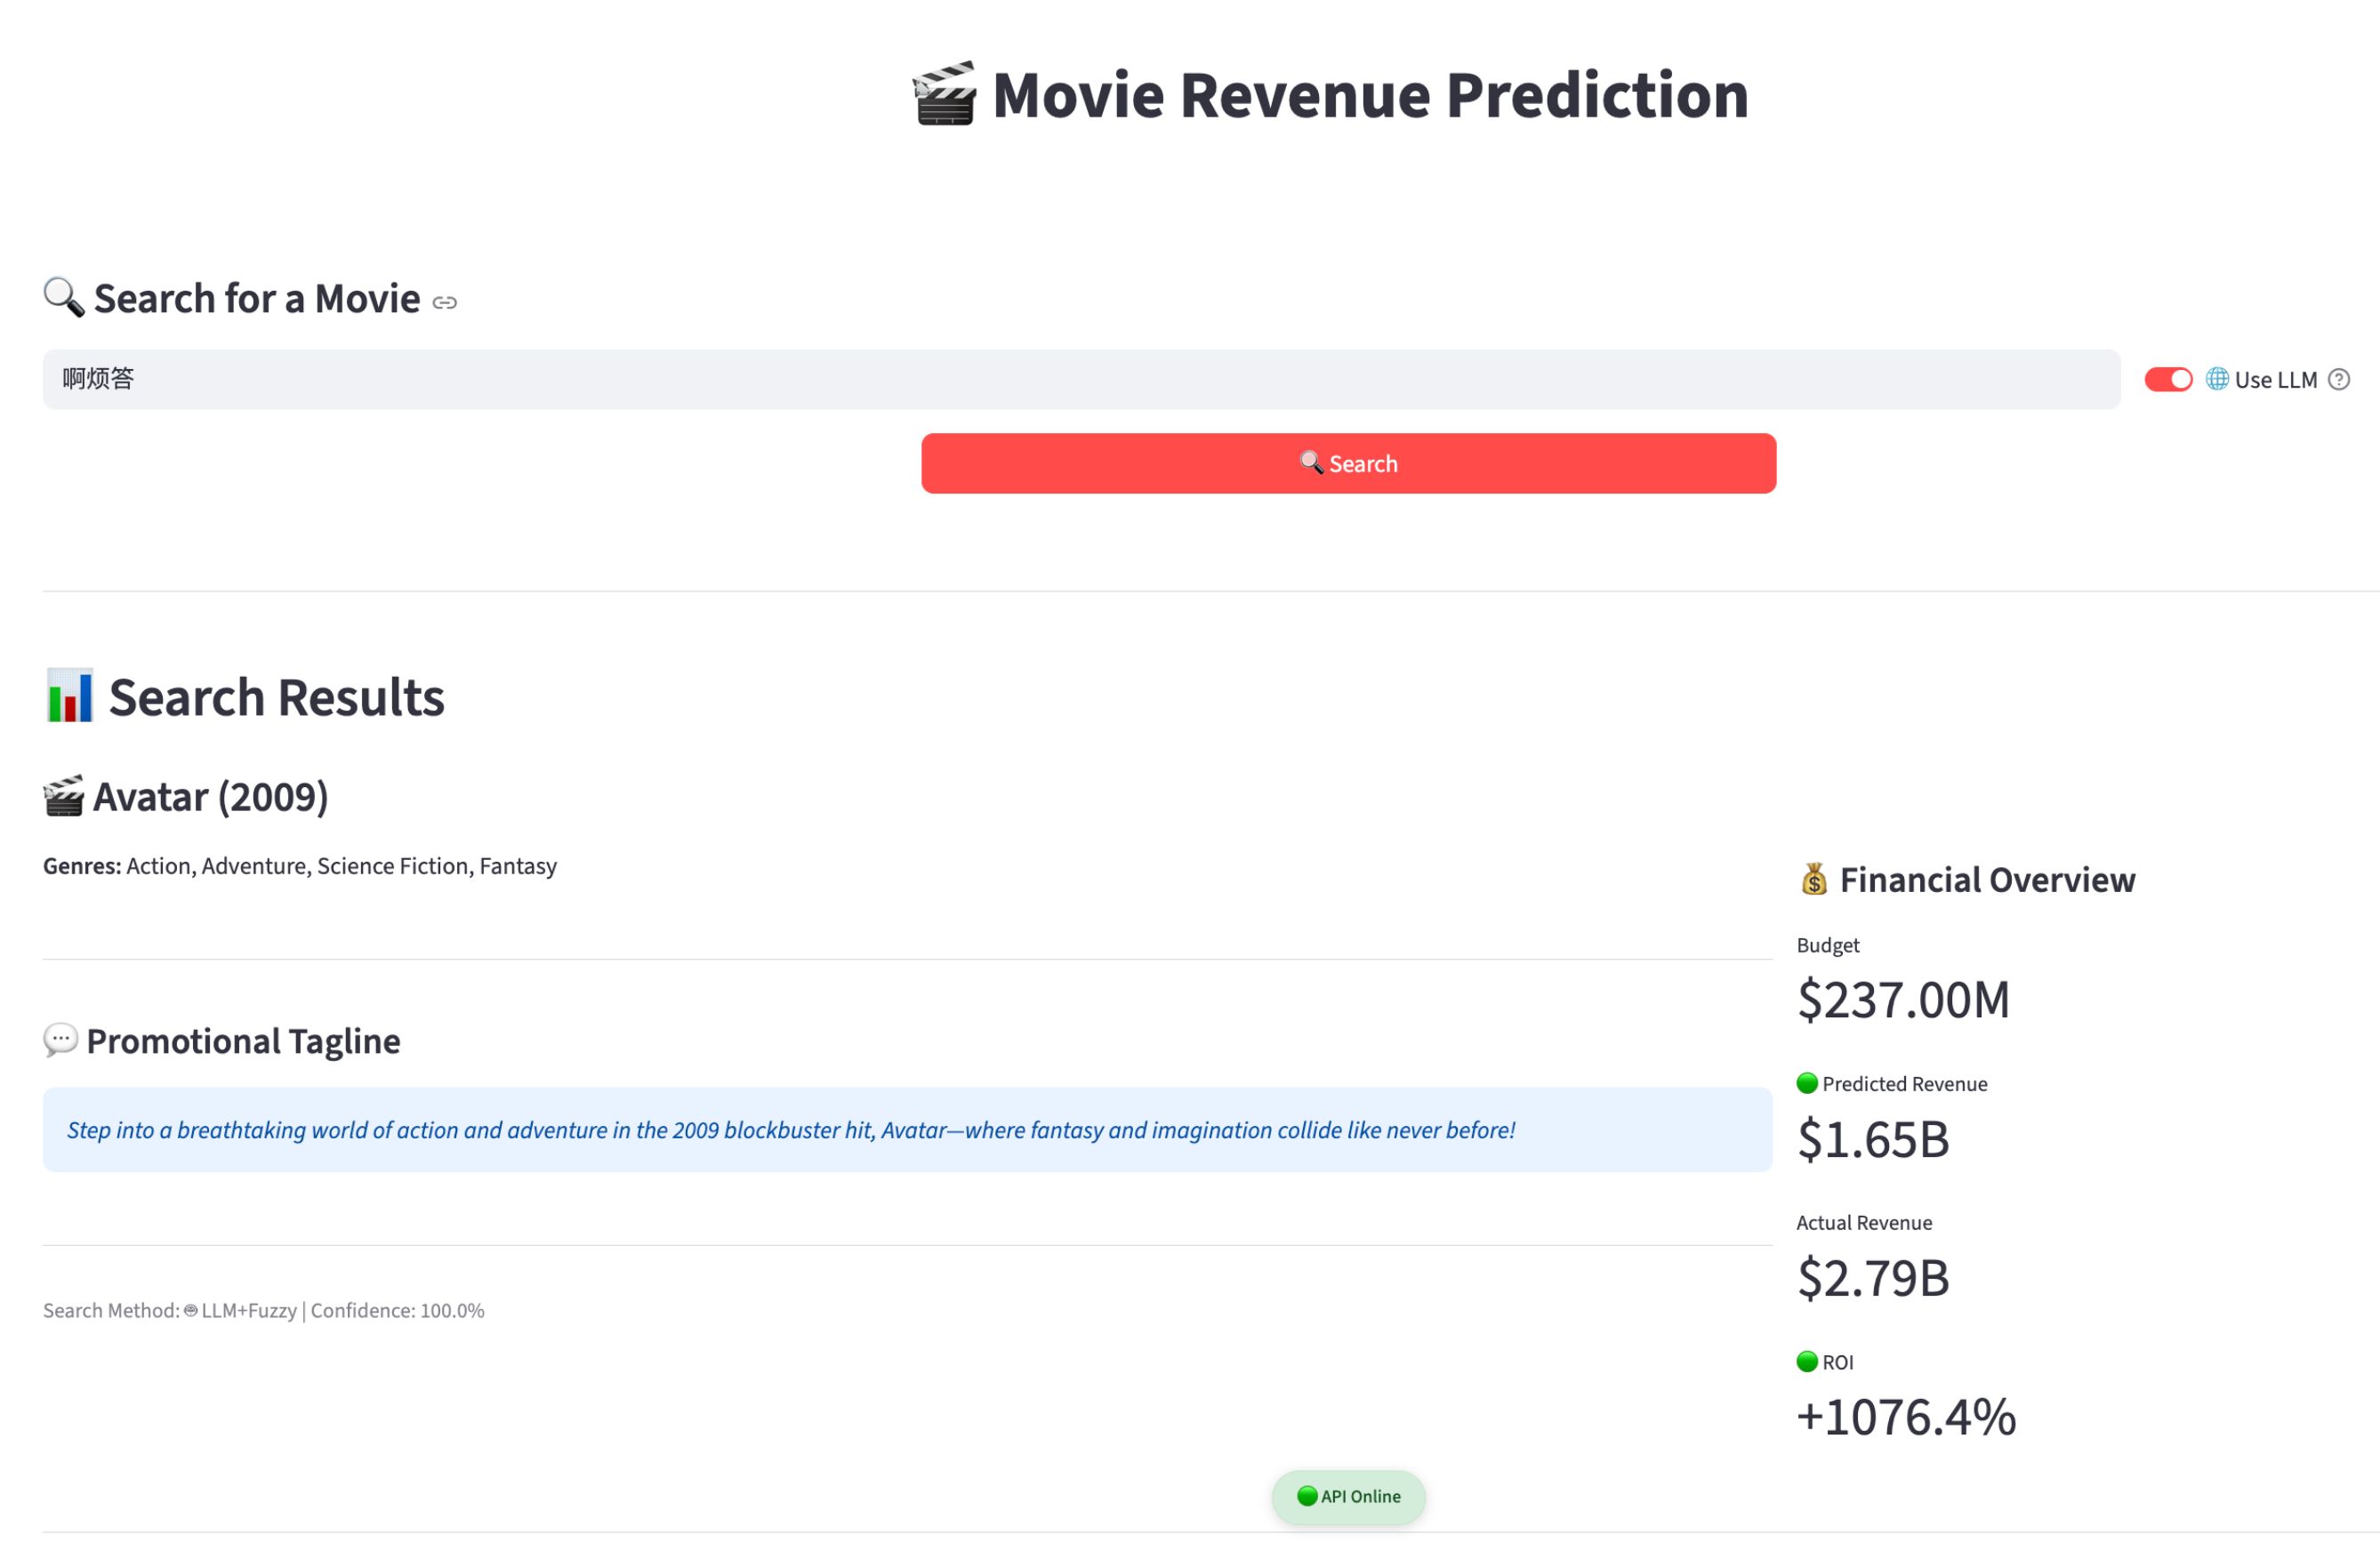
A backend service and web UI are delivered to support real-time movie search and prediction, plus LLM-based promotional tagline generation.
API Endpoints
1 | GET /health - used by Streamlit to check backend liveness |
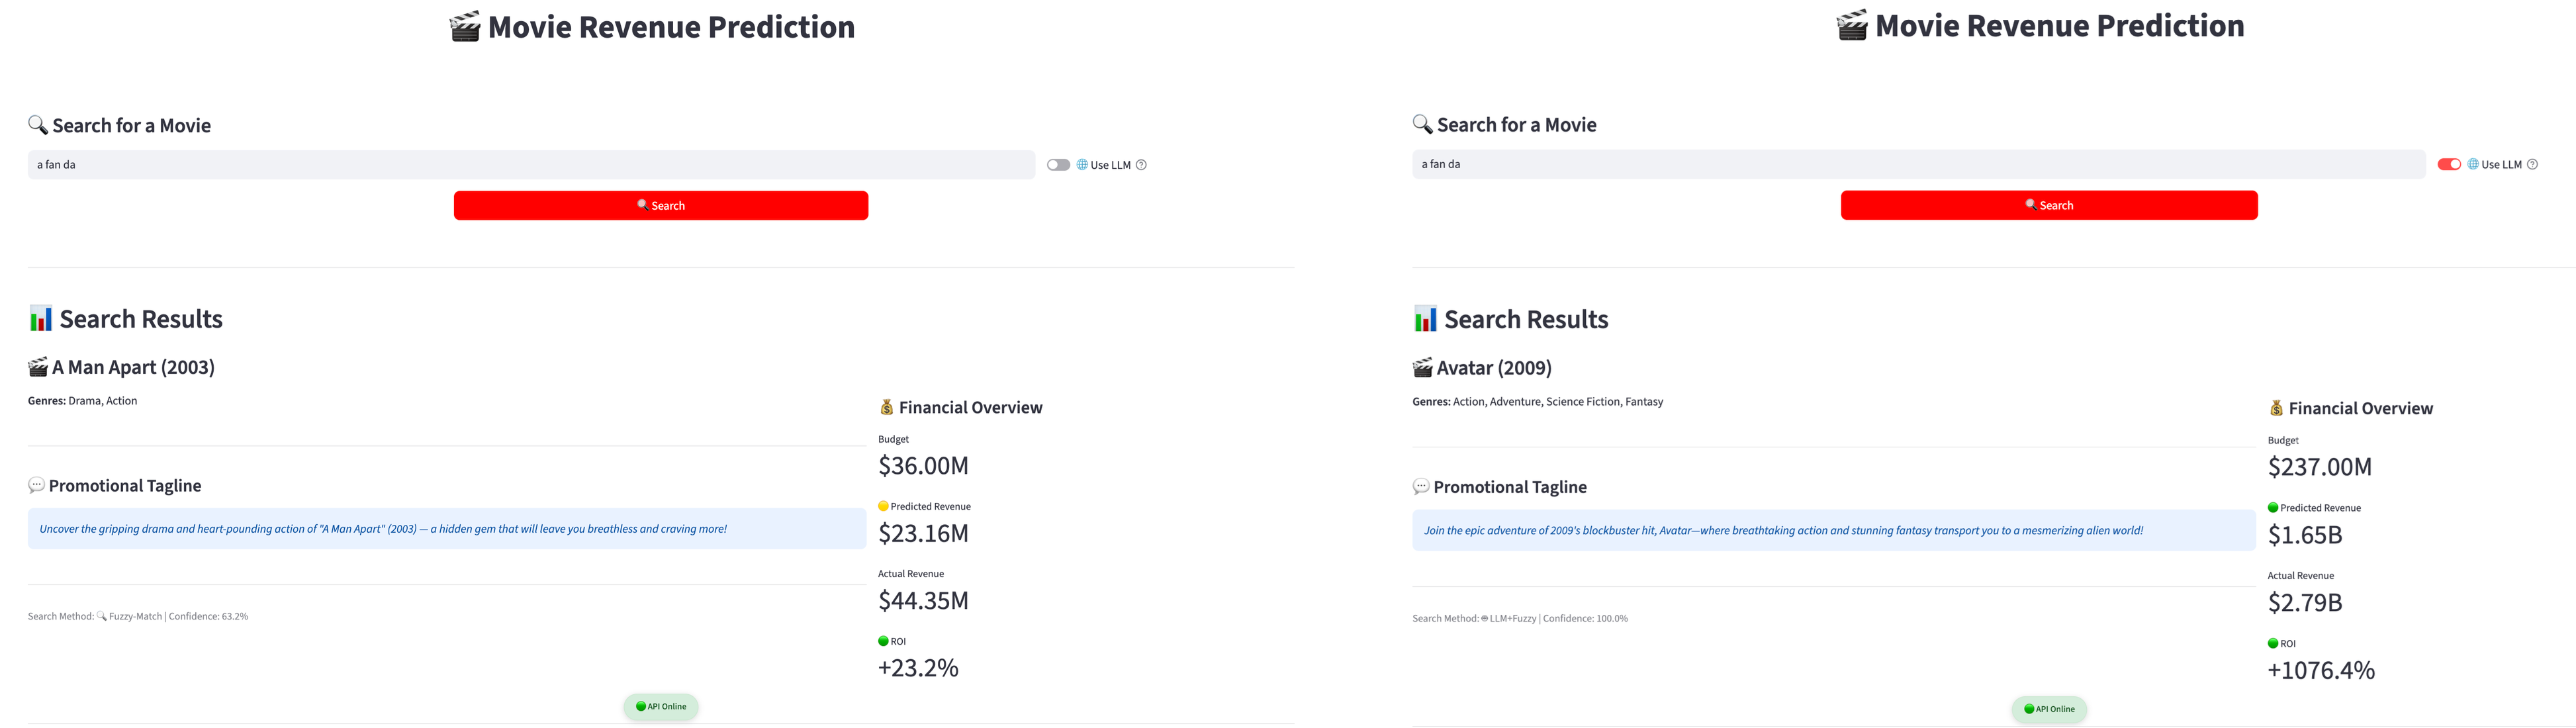
Multilingual Search: LLM Translation + Fuzzy Matching
The search flow combines an LLM with fuzzy matching:
- The LLM translates/refines the user query into a confident English movie title.
- A fuzzy matcher (
SequenceMatcher) ranks titles by similarity and returns the best match.
Testing on 30 samples shows 30%+ more successful searches compared to fuzzy search alone.
Example: LLM-assisted translation to a valid title
Example: fuzzy-only vs LLM+fuzzy on pinyin input
Revenue Prediction in the API Response
The trained model is saved as a .pkl artifact and loaded during backend bootstrapping. After a movie is matched, features are extracted and passed into the model to predict revenue.
LLM Tagline Generation
After the matched movie record is retrieved, selected attributes (e.g., title, genres, release year, revenue category) are used to generate a concise promotional tagline via a structured prompt.
Tech Stack
- Python, Pandas, NumPy
- scikit-learn (Ridge, Random Forest, preprocessing)
- XGBoost
- PyTorch (Transformer)
- FastAPI, Streamlit
- Matplotlib (visualizations)
Resources
- Project Report (PDF): https://drive.google.com/file/d/1Grvi-EP_f7NdrGwVJ_FPXCwSCJqtNeya/view?usp=sharing
- Presentation Slides: https://docs.google.com/presentation/d/1cM9QKWssTwJTBUnte2d2qPjX6HkvuLWg/edit?usp=sharing&ouid=100557288669733938476&rtpof=true&sd=true
- Code Repository: https://github.com/liangjunyi010/IS5126_Final_Project_11